bfp dot com
data analytics | data storytelling
The Happiness-Medal Nexus: Exploring Well-being and Olympic Success
This project started in September 2024 as a passion-driven initiative fueled by a love for data analysis and continuous learning. It leverages open-source datasets, with full attribution given to the original creators. Any modifications made to the data, such as cleansing, wrangling, and normalization, are purely for analytical purposes.
The dataset brings together insights from the World Happiness Report (WHR), Olympic medal counts, and various happiness score components (such as GDP, social support, and more). The aim is to explore key analyses, particularly focusing on the relationship between national happiness and Olympic success. Some points of analysis are:
- Correlation Between Total Medals and Happiness Scores: Investigate whether countries that win more Olympic medals also tend to have higher happiness ladder scores in the WHR.
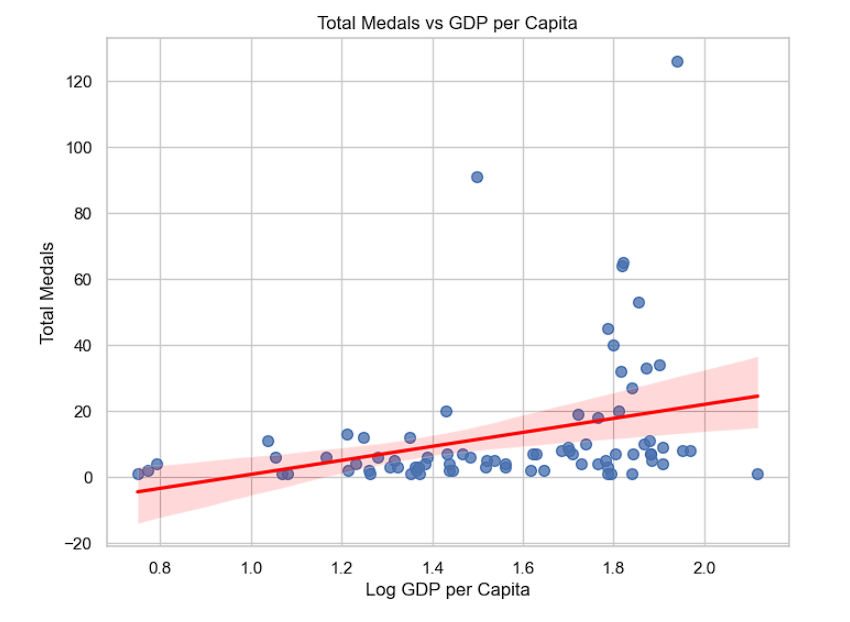
- Economic Prosperity (Log GDP per Capita) and Olympic Performance: Here we explore if wealthier countries, as indicated by GDP per capita, are more successful in the Olympics.
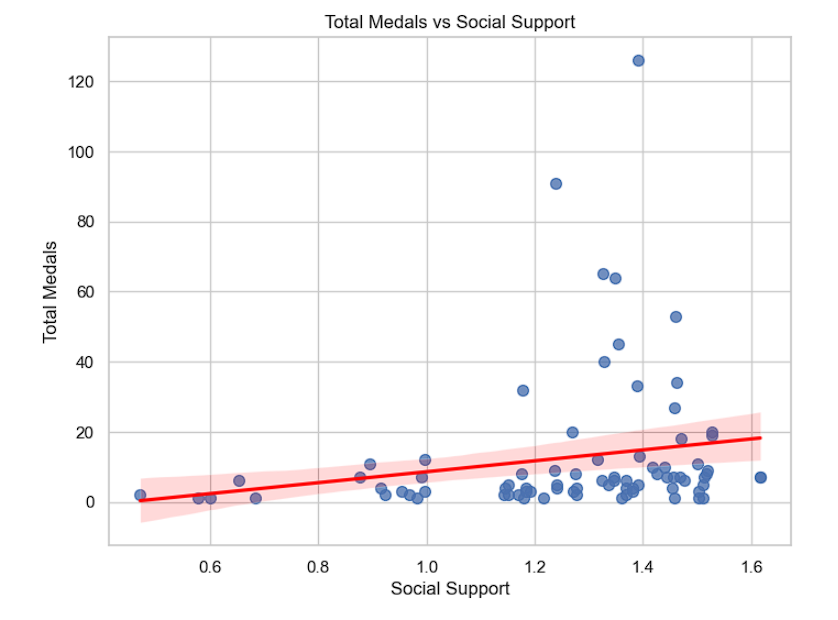
- Social Support and Olympic Success: Assess whether countries with stronger social support systems, as reflected in the WHR, tend to perform better in the Olympics.
- Healthy Life Expectancy and Medal Counts: Analyze whether nations with higher life expectancies—often a sign of a healthier population—have greater Olympic success.
- Perceptions of Corruption and Olympic Performance: Examine if lower levels of perceived corruption are linked to higher medal counts, potentially reflecting systemic factors that influence sports achievement.
- Country and Regional Deep Dives: Provide detailed insights into individual countries and regions, offering a more granular exploration of happiness and sports performance.
----------------------------------------
See corresponding code in accompanying repo folder (https://github.com/dcrefugee/country_happiness_medal/blob/main/_code_happiness_medal_2024/load_and_explore.py)
---------------------------------------------
Let's start looking at the data!
Key insights based on the correlation matrix:
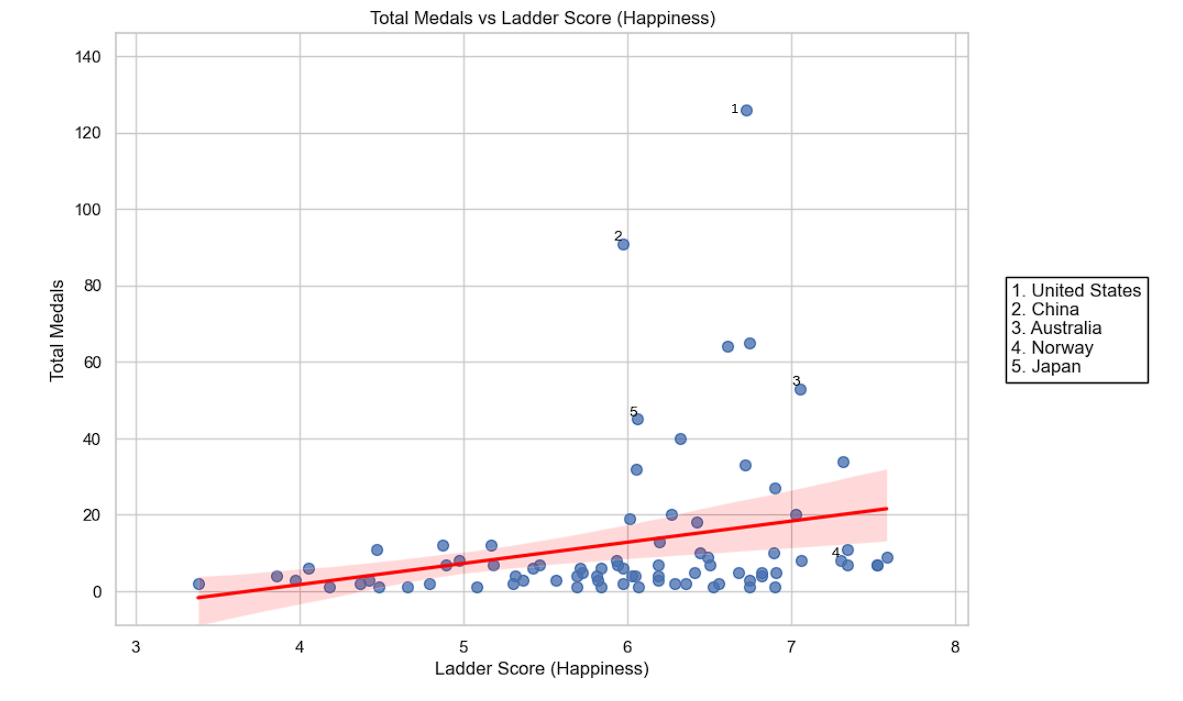
- Total Medals and Happiness Scores (Ladder Score): There is a moderate positive correlation (0.255) between total medals won and a country's happiness score. This suggests that countries with higher happiness levels may also experience greater success in the Olympics, though the relationship is not very strong.
- GDP and Medal Success: The correlation between total medals and GDP per capita is 0.31, indicating that wealthier countries tend to win more Olympic medals. However, the correlation isn't very high, meaning there are other important factors at play.
- Social Support and Olympic Performance: There is a weaker positive correlation (0.19) between social support and total medals won, showing that higher social support does not strongly translate into Olympic success, though it may still have some influence.
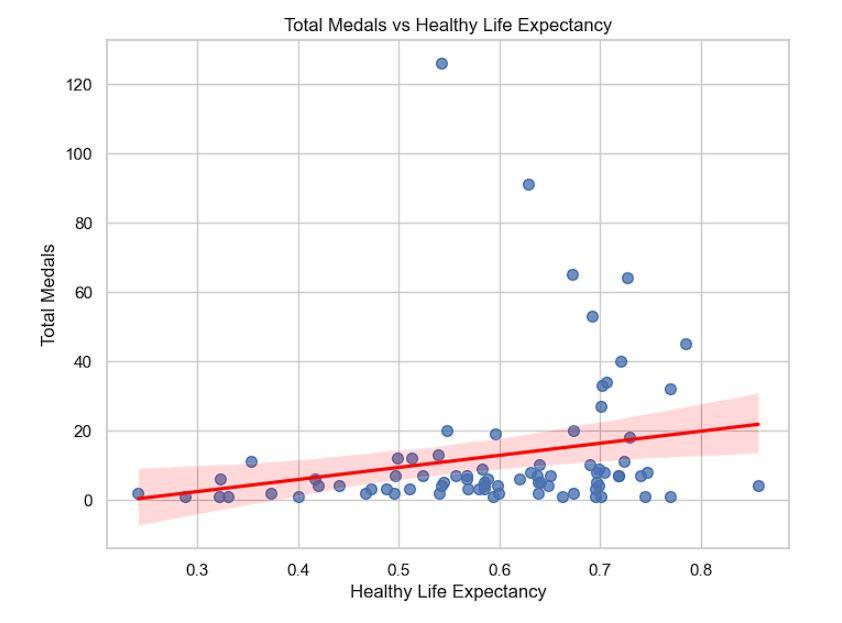
- Healthy Life Expectancy and Medal Counts: A correlation of 0.21 suggests a slight link between higher life expectancy and Olympic success. Healthier nations may have a small advantage in Olympic sports, but it's not a decisive factor on its own.
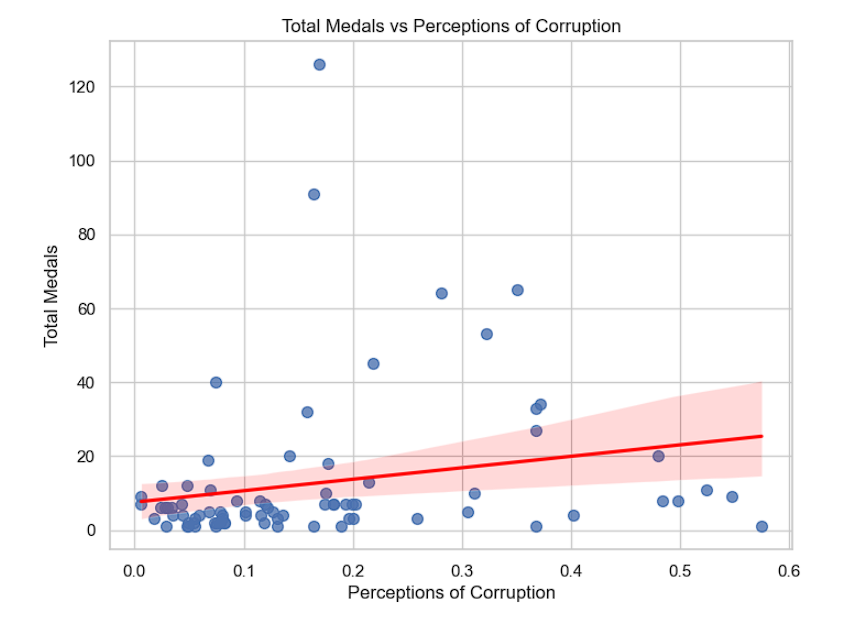
- Corruption and Medal Success: The correlation between perceived corruption and total medals is 0.21. Countries with lower corruption tend to perform slightly better in the Olympics, but the effect is not particularly strong.
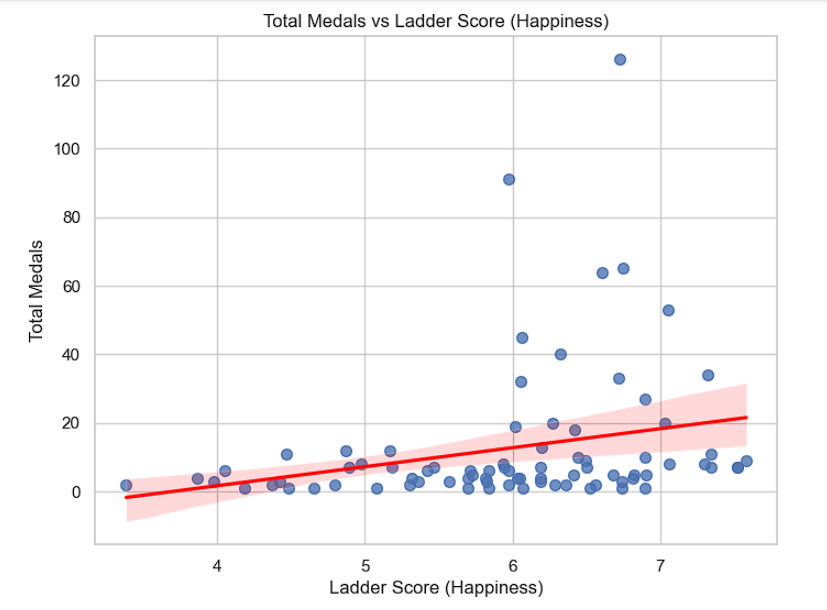
The next chart shows the Total Medals vs Ladder Score (Happiness) chart with select countries highlighted: United States, China, Australia, Norway, and Japan. These countries show some interesting trends in both happiness scores and Olympic success.
United States
High medal count and relatively high happiness score. Reflects the balance between economic prosperity, sports infrastructure, and societal well-being contributing to Olympic success.
China
Strong Olympic performance, but the happiness score is lower than the United States. This demonstrates that high medal counts are not always tied to societal happiness but can be the result of targeted sports programs and government investment.
Australia
High happiness score and a substantial number of medals. A good example of how countries with high levels of happiness can also perform well at the Olympics, likely due to strong social systems and investments in sports.
Norway
Small population but high medal counts relative to size, combined with one of the highest happiness scores. Indicates that smaller, happier nations with strong health and sports programs can perform disproportionately well in international sports.
Japan
A moderate number of medals and relatively high happiness, though not at the level of the U.S. or China in terms of total medals. This suggests that happiness is a factor, but not the primary variable in driving sports success.
These insights show that while there is a positive relationship between happiness and Olympic success, it is not the sole determining factor, with economic and structural investments playing a significant role.
---------------
Data Definition
A Z-score is a way of measuring how far a particular value is from the average (or mean) in a group of values. Think of it as a tool that helps you understand if something is "normal" or "unusual" compared to the rest of the data.
Key Points:
Z-Score measures distance from the average: If your Z-score is 0, you’re exactly at the average. If your Z-score is positive, you're above the average; if it's negative, you're below the average.
A Z-score of +1 means you’re 1 standard deviation above the average, and a Z-score of -1 means you’re 1 standard deviation below the average.
Why is this Useful?
Z-scores are used everywhere from sports to finance to analytics. For example:
- In sports: Imagine comparing a basketball player's performance to the average across a whole season. A Z-score can help you see if their score in a particular game was unusually good (or bad).
- In business: If a store's sales suddenly spike or drop, a Z-score can show whether that change is something truly unusual or just part of the normal ups and downs.
**https://www.khanacademy.org/math/statistics-probability
----------
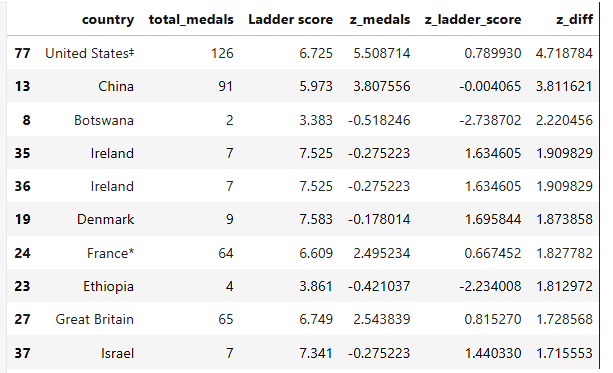
Now here are some of the outliers identified based on large differences between their Olympic medal counts (z-scores) and happiness scores (z-scores):
United States
Very high number of medals (z_medals: 5.51), but its happiness score is not as exceptional (z_ladder_score: 0.79). This suggests that while the U.S. excels in Olympic performance, its societal happiness does not reflect the same extremity.
China
High Olympic success (z_medals: 3.81), but with a lower happiness score (z_ladder_score: -0.004). China's Olympic prowess contrasts sharply with its relatively modest happiness score, indicating that sports investment is strong, but broader societal well-being may not be at the same level.
Botswana
Low number of medals (z_medals: -0.52) and a very low happiness score (z_ladder_score: -2.74). Botswana is an example of a country with both low Olympic performance and happiness, indicating systemic challenges that might be hindering both societal well-being and sports investment.
Ireland
Moderate medal count (z_medals: -0.27) but very high happiness (z_ladder_score: 1.63). Ireland stands out as a country where societal well-being is exceptionally high, but its Olympic performance doesn't match its happiness score, suggesting that sports may not be as prioritized.
Denmark
Similar to Ireland, Denmark has a moderate medal count (z_medals: -0.18) but very high happiness (z_ladder_score: 1.70). This shows that Denmark, despite its smaller medal tally, excels in societal happiness, perhaps due to strong social welfare and support systems.
Ethiopia
Low Olympic success (z_medals: -0.42) but also a low happiness score (z_ladder_score: -2.23). Ethiopia faces challenges in both societal happiness and sports performance, potentially due to economic and infrastructural factors.
These examples highlight countries that deviate significantly from the general correlation between happiness and Olympic success, each with its own context.
-------------------------------------------
See corresponding code in accompanying repo folder: (https://github.com/dcrefugee/country_happiness_medal/blob/main/_code_happiness_medal_2024/load_and_explore.py)
-----------------------------------------
The next chart (below) shows the most insightful correlations between Olympic medal counts and various metrics from the World Happiness Report:
Logarithmic (log) GDP per Capita (0.31)
This has the strongest correlation with total medals. Wealthier nations tend to invest more in sports infrastructure and training programs, which contributes to higher Olympic success. However, the correlation is moderate, suggesting that while economic factors are important, they are not the only drivers of Olympic performance.
Healthy Life Expectancy (0.22)
Countries with higher life expectancy tend to perform better in the Olympics. This may reflect a healthier population that has more potential to engage in sports and competitive activities. Still, the correlation isn't very strong, indicating other factors like sports culture and investment also play a role.
Social Support (0.19)
The relationship between social support and Olympic success is weaker, though still positive. This suggests that while strong social networks and community well-being may contribute to a country's overall success, they are not major factors driving Olympic medal counts.
Variable Conclusion: The most powerful predictor for Olympic success, based on these metrics, is economic prosperity (Log GDP per capita), reinforcing the idea that wealthier countries have the resources to excel in global competitions. Health also plays a role, but it is less significant compared to financial resources.

Here are some visualizations of select countries further explaining these correlations.
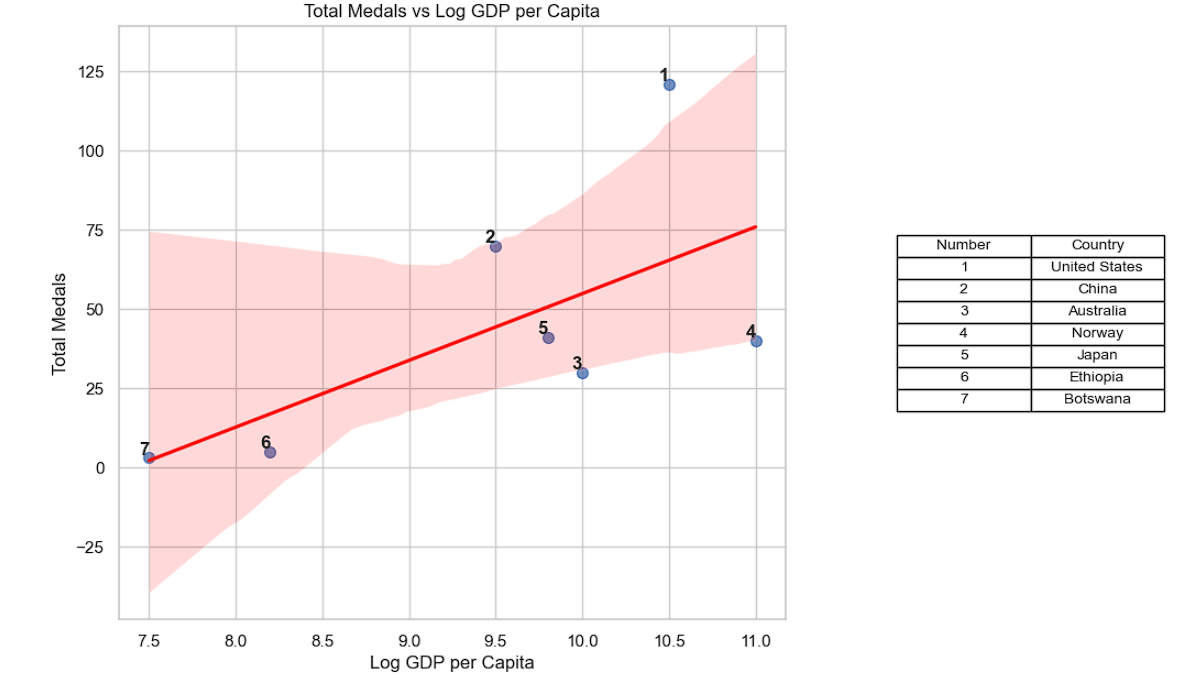
Total Medals vs Log GDP per Capita
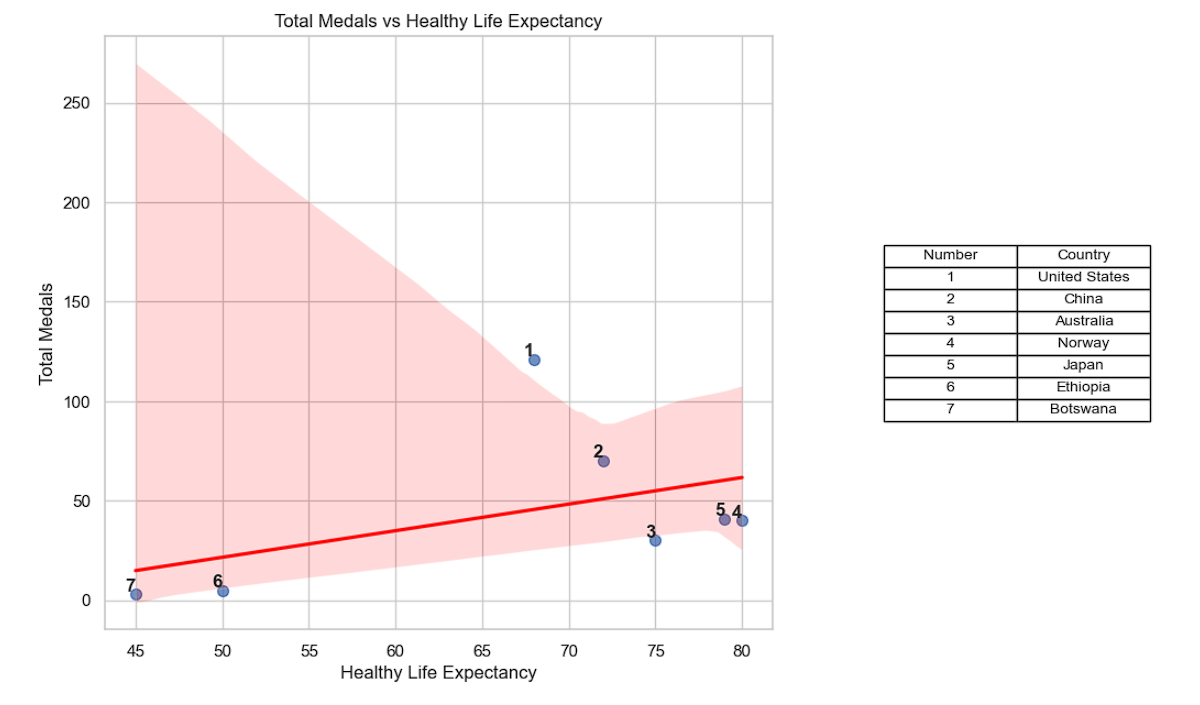
Countries like the United States, China, Australia, Norway, Japan, and Ethiopia are labeled, helping to illustrate the relationship between wealth and Olympic success. Wealthier nations (e.g., United States, China) dominate the upper-right of the chart, while less wealthy nations (e.g., Ethiopia, Botswana) are positioned lower. Total Medals vs Healthy Life Expectancy:
Similarly, countries like Australia, Norway, and Japan, with high life expectancy and solid medal counts, are labeled. Less healthy nations (e.g., Ethiopia, Botswana) are at the lower end, reinforcing the connection between health and Olympic performance.
These labels provide a clearer understanding of which countries are represented in the analysis.
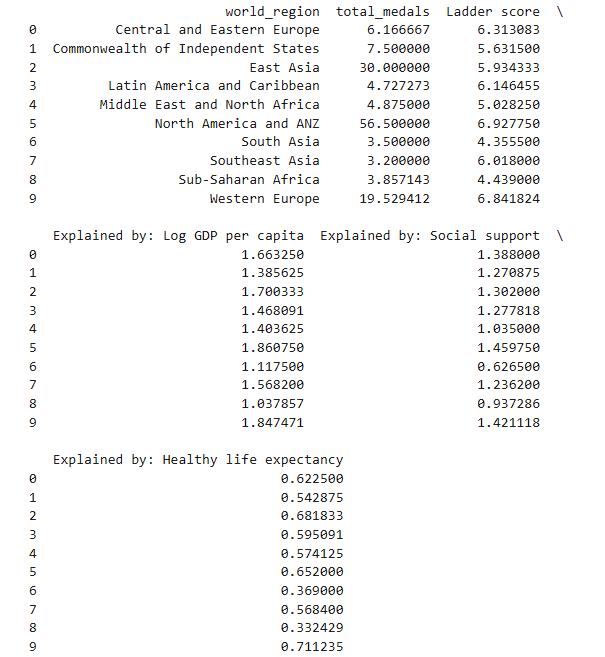
Here are some insights by region based on the averages of key metrics we have been looking at such as total medals, happiness scores, and components like GDP, social support, and healthy life expectancy:
North America and ANZ
Average Medals: 56.5 (highest of all regions). Average Happiness (Ladder Score): 6.93, one of the highest. GDP per Capita: 1.86 (highest), reflecting the economic prosperity of this region. Social Support and Health: Both are among the highest, suggesting that countries like the U.S., Canada, and Australia have strong social systems and health, contributing to their Olympic success.
Western Europe
Average Medals: 19.53, second highest. Average Happiness: 6.84, also very high. GDP per Capita: 1.85 (second only to North America), reflecting strong economic conditions. Western Europe’s strong performance in both Olympic success and happiness shows the benefits of economic wealth and social support systems.
East Asia
Average Medals: 30 (dominated by China). Average Happiness: 5.93 (moderate). GDP per Capita: 1.70, showing that economic prosperity drives Olympic success despite relatively lower happiness compared to Western countries.
Sub-Saharan Africa
Average Medals: 3.86 (low). Average Happiness: 4.44, one of the lowest. GDP per Capita: 1.04, reflecting economic challenges. The lower happiness and economic indicators correlate with fewer Olympic medals, suggesting that limited resources and social challenges hinder both well-being and sports development.
South Asia
Average Medals: 3.5 (similar to Sub-Saharan Africa). Average Happiness: 4.36, very low. GDP per Capita: 1.12, indicating modest economic conditions. Social support is particularly low (0.63), which might explain why the region struggles in both happiness and Olympic success.
Some overall thoughts for this section: Regions with higher GDP per capita and strong social support systems (e.g., North America, Western Europe) tend to have both higher happiness and greater Olympic success. Regions with lower economic indicators (e.g., Sub-Saharan Africa, South Asia) have fewer Olympic medals and lower happiness scores, reflecting broader systemic challenges.
Thank you for reading this far! Let’s dive deeper into regional disparities by breaking down each region’s performance across multiple dimensions. We’ll explore more focused analyses on how different regions are shaped by economic, social, and health factors, and how those factors contribute to both their happiness and Olympic success.
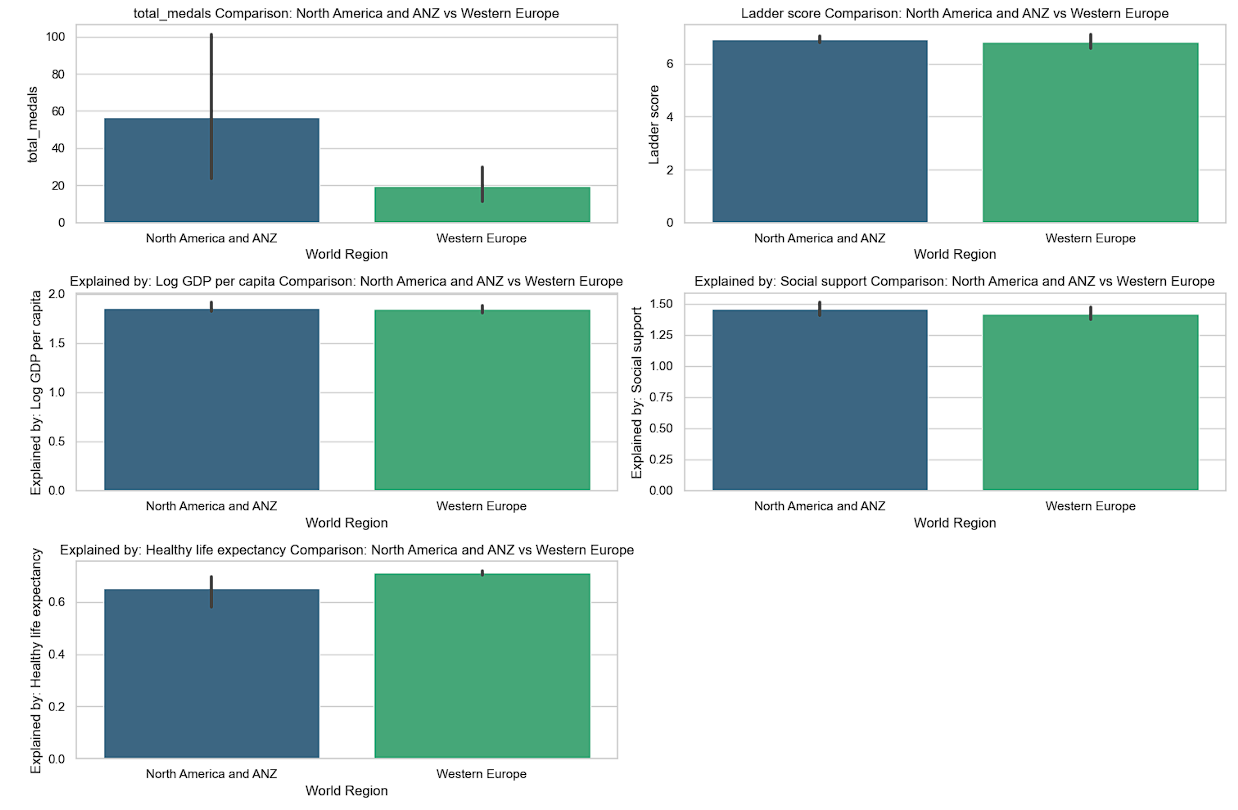
These visualizations above compare key metrics between North America and ANZ and Western Europe, showing the following insights
** America and ANZ = American, Australia and New Zealand
Total Medals
North America and ANZ significantly outperform Western Europe in terms of Olympic medals, reflecting higher investment in sports infrastructure, larger populations, and stronger athletic programs.
Happiness (Ladder Score)
Both regions show high happiness scores, but Western Europe slightly edges out North America and ANZ. This highlights the strong social safety nets and quality of life in both regions.
Log GDP per Capita
North America and ANZ have slightly higher GDP per capita on average, indicating stronger economic conditions. However, Western Europe is close behind, showing that both regions are wealthy and prosperous.
Social Support
Both regions score similarly, but North America and ANZ have slightly higher social support. Strong social networks and community well-being are common to both regions, contributing to their high happiness scores.
Healthy Life Expectancy
Western Europe leads slightly in this category, which may be due to comprehensive healthcare systems and a focus on preventive health measures.
Some Conclusions: North America and ANZ excel in Olympic success and GDP, but Western Europe performs equally well in social factors like life expectancy and happiness. These regions demonstrate that strong economic and social foundations support both happiness and Olympic achievement.
Next, we will explore the underperforming regions (Sub-Saharan Africa and South Asia) and examine the socio-economic challenges they face.
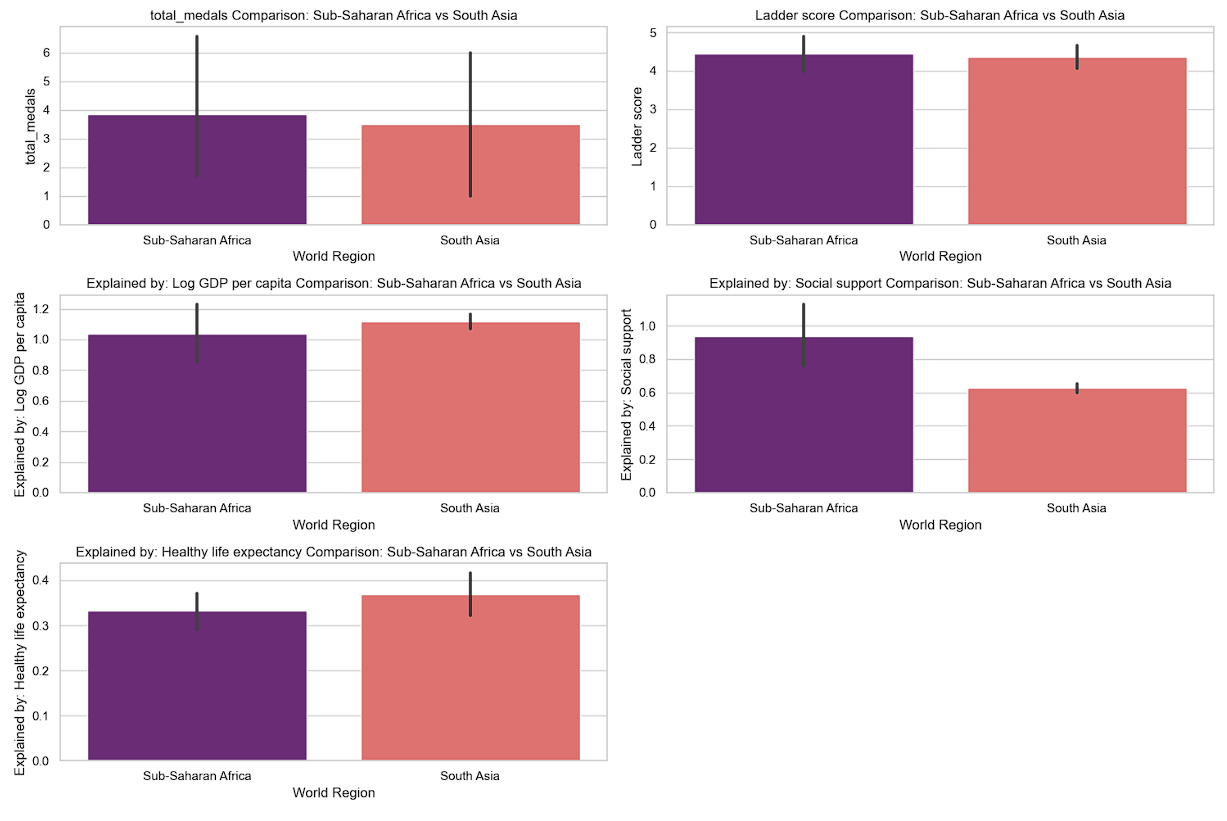
Here are some key insights from the comparison of Sub-Saharan Africa and South Asia across relevant metrics:
Total Medals
Both regions have significantly lower Olympic medal counts compared to wealthier regions. This is a reflection of lower investment in sports infrastructure, training, and international competition exposure.
Happiness (Ladder Score)
Both regions have lower happiness scores, with South Asia trailing slightly behind Sub-Saharan Africa. This indicates widespread social and economic challenges that negatively affect well-being.
Log GDP per Capita
Economic conditions in these regions are modest, with South Asia having a slightly higher GDP per capita than Sub-Saharan Africa. Both regions struggle with limited financial resources, which constrains their ability to improve infrastructure, healthcare, and social systems.
Social Support
Social support is notably low in both regions, but especially in South Asia. Weak social safety nets may contribute to lower happiness and less focus on athletic achievement or public health.
Healthy Life Expectancy
Life expectancy is low in both regions, particularly in Sub-Saharan Africa, where healthcare systems are less developed. The lack of access to quality healthcare diminishes both happiness and the ability to produce competitive athletes.
Some Conclusion: Sub-Saharan Africa and South Asia face significant socio-economic challenges that impact both happiness and Olympic success. Lower GDP, weak social support, and poor health outcomes contribute to their underperformance in sports and general well-being. These regions highlight the need for greater investment in public health, infrastructure, and social welfare to improve both happiness and global competitiveness.
Moving forward we will explore additional regional comparisons and insights, diving into:
Middle East and North Africa (MENA): Analyze how this region compares in terms of happiness, medals, and social factors.
Latin America and Caribbean: Investigate its relatively high happiness but moderate Olympic success.
East Asia: Focus on the disparity between strong Olympic performance and moderate happiness.
Comparing these regions and explore what drives the outcomes in terms of economic, social, and health factors.
Beginning with comparisons between MENA, Latin America, and East Asia.
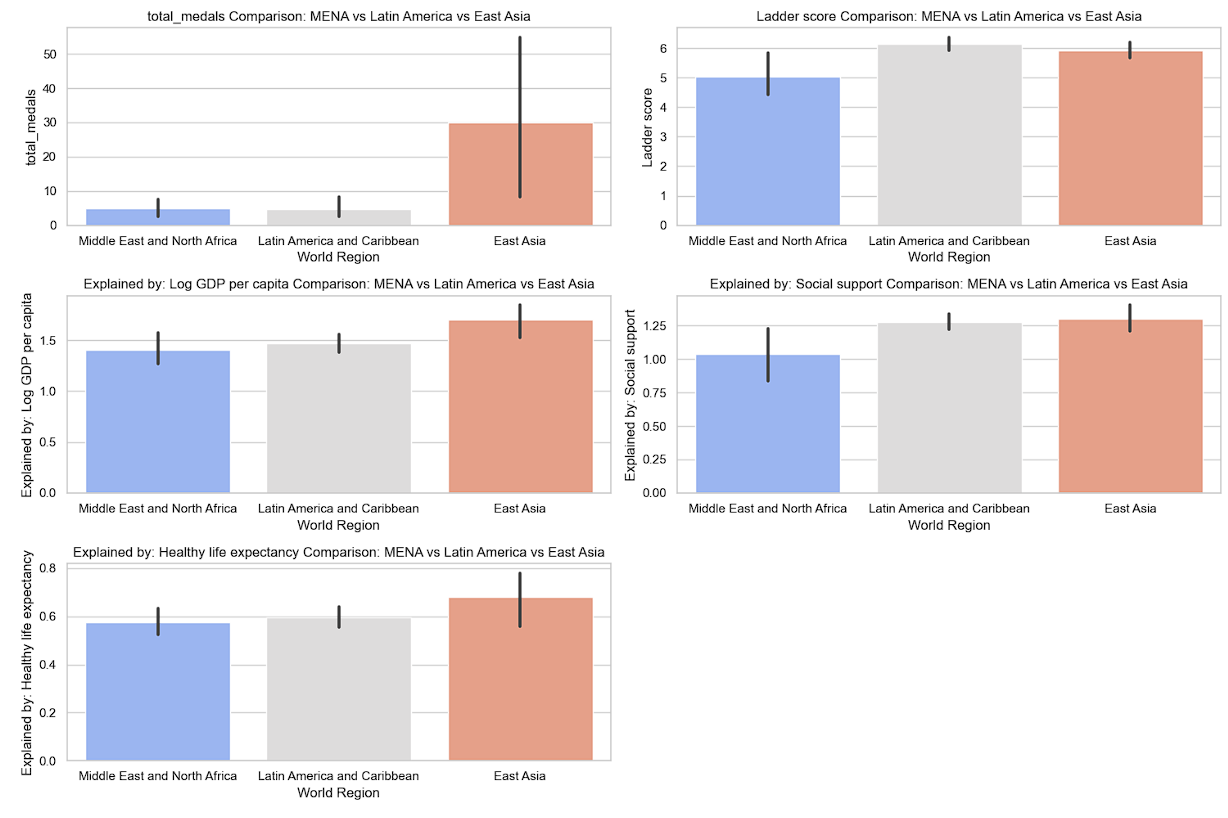
Key insights from the comparison between Middle East and North Africa (MENA), Latin America and Caribbean, and East Asia:
Total Medals
East Asia leads significantly in Olympic success, driven by countries like China, which invest heavily in sports. Latin America and the Caribbean and MENA regions lag behind, with relatively modest medal counts. These regions may face challenges in infrastructure and investment in athletics.
Happiness (Ladder Score)
Latin America and the Caribbean has higher happiness compared to MENA and East Asia. Despite lower economic power and fewer medals, the region has a strong social culture and community bonds, which may contribute to higher well-being. East Asia shows moderate happiness despite high Olympic success, which could reflect the cultural and societal pressures in nations like China and Japan.
Log GDP per Capita
East Asia again leads with a higher average GDP, while Latin America and MENA are lower but comparable. Economic strength clearly plays a role in Olympic success, especially in East Asia, but it does not always correlate directly with happiness.
Social Support
Latin America has higher social support compared to MENA and East Asia. Strong social connections in Latin America may explain why happiness remains high, despite lower economic power and fewer Olympic medals.
Health Life Expectancy
East Asia leads again, with Latin America and MENA following. Healthier populations in East Asia contribute to better sports performance, while relatively lower life expectancies in MENA may limit both happiness and athletic achievement.
Summary of Insights: East Asia's high economic power and health systems lead to strong Olympic results, but societal happiness is tempered by cultural pressures. Latin America exhibits a unique pattern of high happiness, even though it ranks lower in both economic and athletic success, likely driven by strong social networks and community cohesion. MENA faces challenges in all areas, with lower happiness, GDP, and life expectancy contributing to its lower Olympic performance.
These comparisons show how different regions balance economic, social, and cultural factors to influence both their happiness and Olympic results.
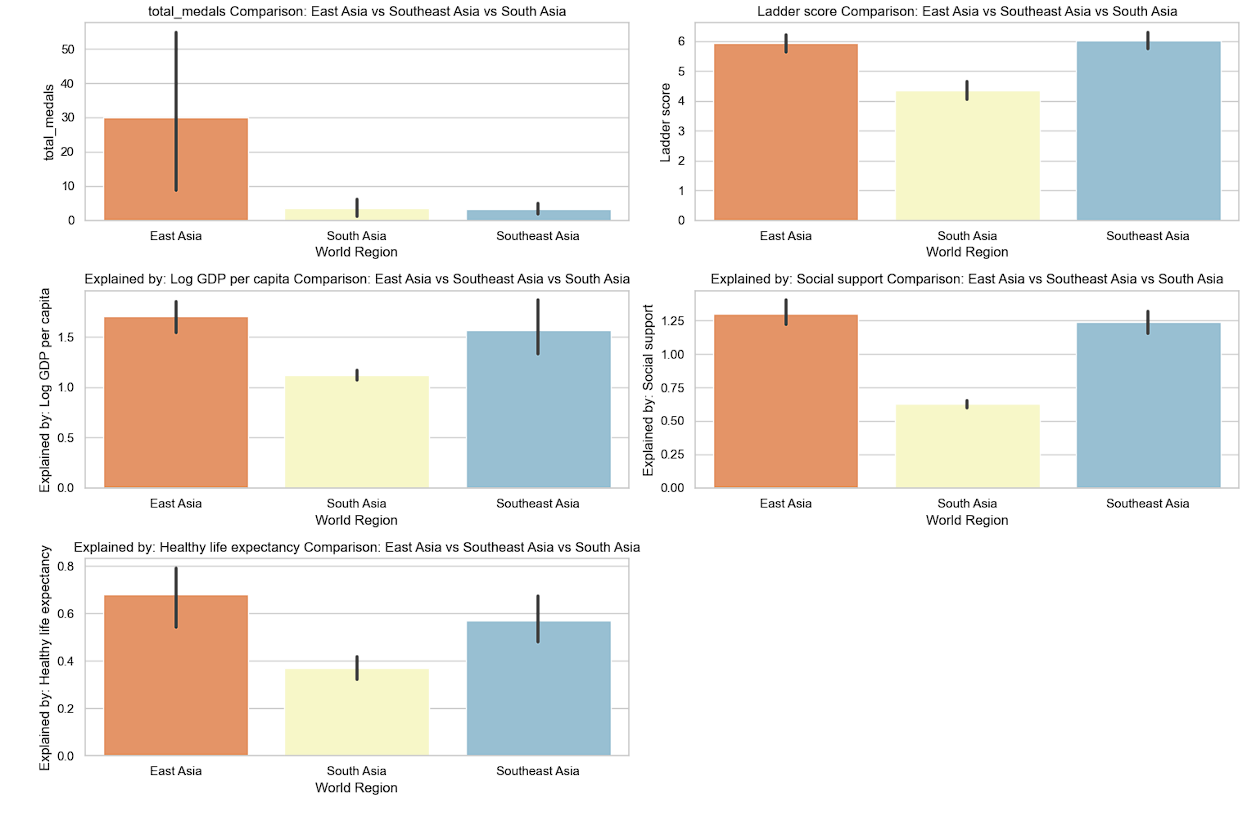
Key insights from the comparison between East Asia, Southeast Asia, and South Asia:
Total Medals
East Asia (led by countries like China and Japan) significantly outperforms Southeast Asia and South Asia in Olympic success. This demonstrates how economic strength and investment in sports infrastructure contribute to a stronger presence at the Olympics.
Happiness (Ladder Score)
Southeast Asia has a relatively high happiness score compared to East Asia and South Asia. Despite lower economic power and fewer Olympic medals, the region benefits from strong social and cultural cohesion. South Asia trails in happiness, reflecting broader socio-economic challenges.
Log GDP per Capita
East Asia has a much higher GDP per capita compared to the other two regions. This economic advantage helps explain its dominance in Olympic success, while South Asia struggles with lower GDP levels.
Social Support
Southeast Asia shows strong social support, which may explain the higher happiness levels, even though the region has fewer medals and lower GDP. South Asia has particularly low social support, contributing to its lower happiness and Olympic performance.
Healthy Life Expectancy
East Asia leads with higher life expectancy, supporting both better health outcomes and stronger Olympic performance. In contrast, South Asia has much lower life expectancy, reflecting healthcare challenges.
Some conclusions for for Asian Regions: East Asia lead in Olympic success and health, driven by economic power and government investment in sports, but happiness levels remain moderate due to cultural and societal pressures. Southeast Asia enjoys higher happiness, despite economic and Olympic underperformance, likely due to strong social networks. South Asia faces substantial challenges across the board, with low GDP, social support, and life expectancy contributing to underperformance in both happiness and athletics.
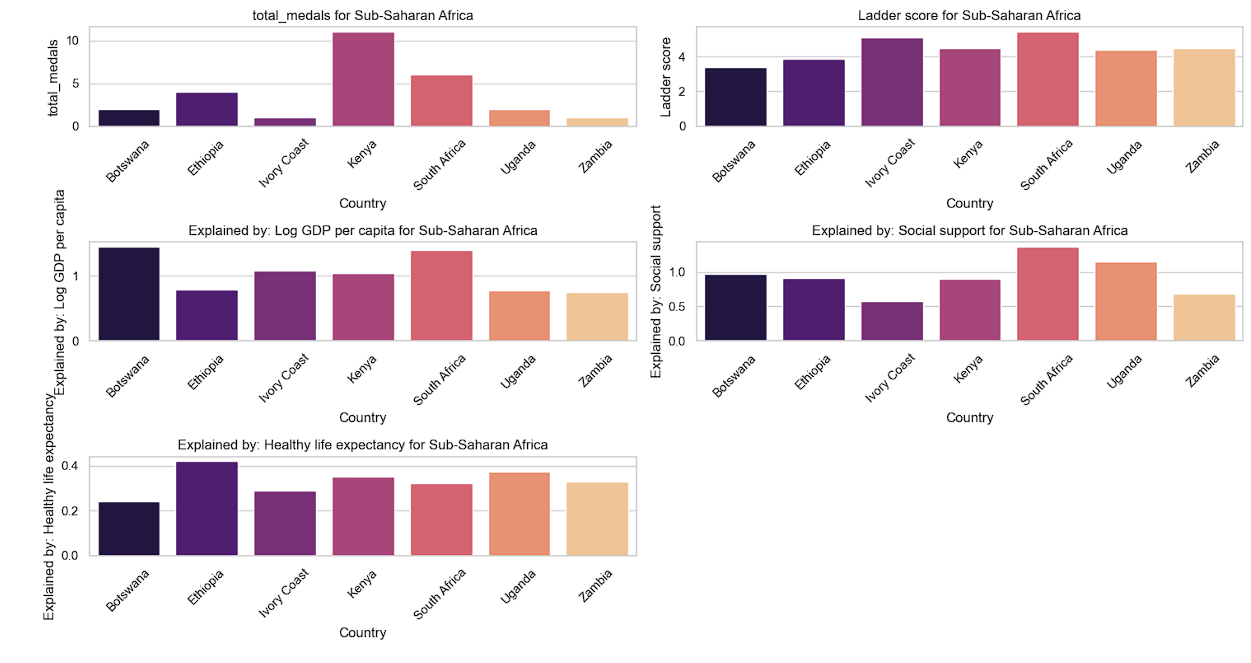
Key insights from the analysis of Sub-Saharan Africa across relevant metrics:
- Total Medals: The Olympic performance is relatively low across all countries in the region. This indicates a lack of resources and infrastructure for competitive sports, with few countries able to reach the global stage in the Olympics.
- Happiness (Ladder Score): Happiness scores are low across the board, reflecting broader socio-economic challenges such as poverty, lack of access to basic services, and political instability.
- Log GDP per Capita: The region's GDP per capita is among the lowest compared to other global regions. This economic disadvantage contributes to limited investment in sports, education, and healthcare, which in turn affects both happiness and athletic development.
- Social Support: Social support is relatively low, indicating weaker social safety nets and less community cohesion. This may be due to the high levels of inequality and lack of public resources across many countries in Sub-Saharan Africa.
- Healthy Life Expectancy: Life expectancy is also low, driven by healthcare challenges such as limited access to medical facilities, high disease burden, and lower public health spending. This has a direct impact on both societal well-being and the potential to develop competitive athletes.
Summary of Sub-Saharan Africa: The region faces multiple intersecting challenges in terms of economic development, healthcare, and social support, which contribute to its lower happiness and Olympic performance. Without substantial investment in public infrastructure, healthcare, and sports development, the region is unlikely to see significant improvements in either happiness or Olympic success in the near future. These factors help explain why Sub-Saharan Africa lags behind other regions in terms of both well-being and global sports competitiveness.
Last update: 14 September 2024
Data Sources:
- World Happiness Report: https://worldhappiness.report/
- Olympic Medals - Paris 2024: https://olympics.com/en/paris-2024/medals